
Explore The Bigger Picture
Explore power stations and connections across Britain, following your curiosity from one place to the next.
 UKGrid Live
Energy & Infrastructure / Web
Every light, every journey, every ordinary day is powered by something extraordinary. Discover Britain's electricity network and the places behind it.
Open UKGrid Live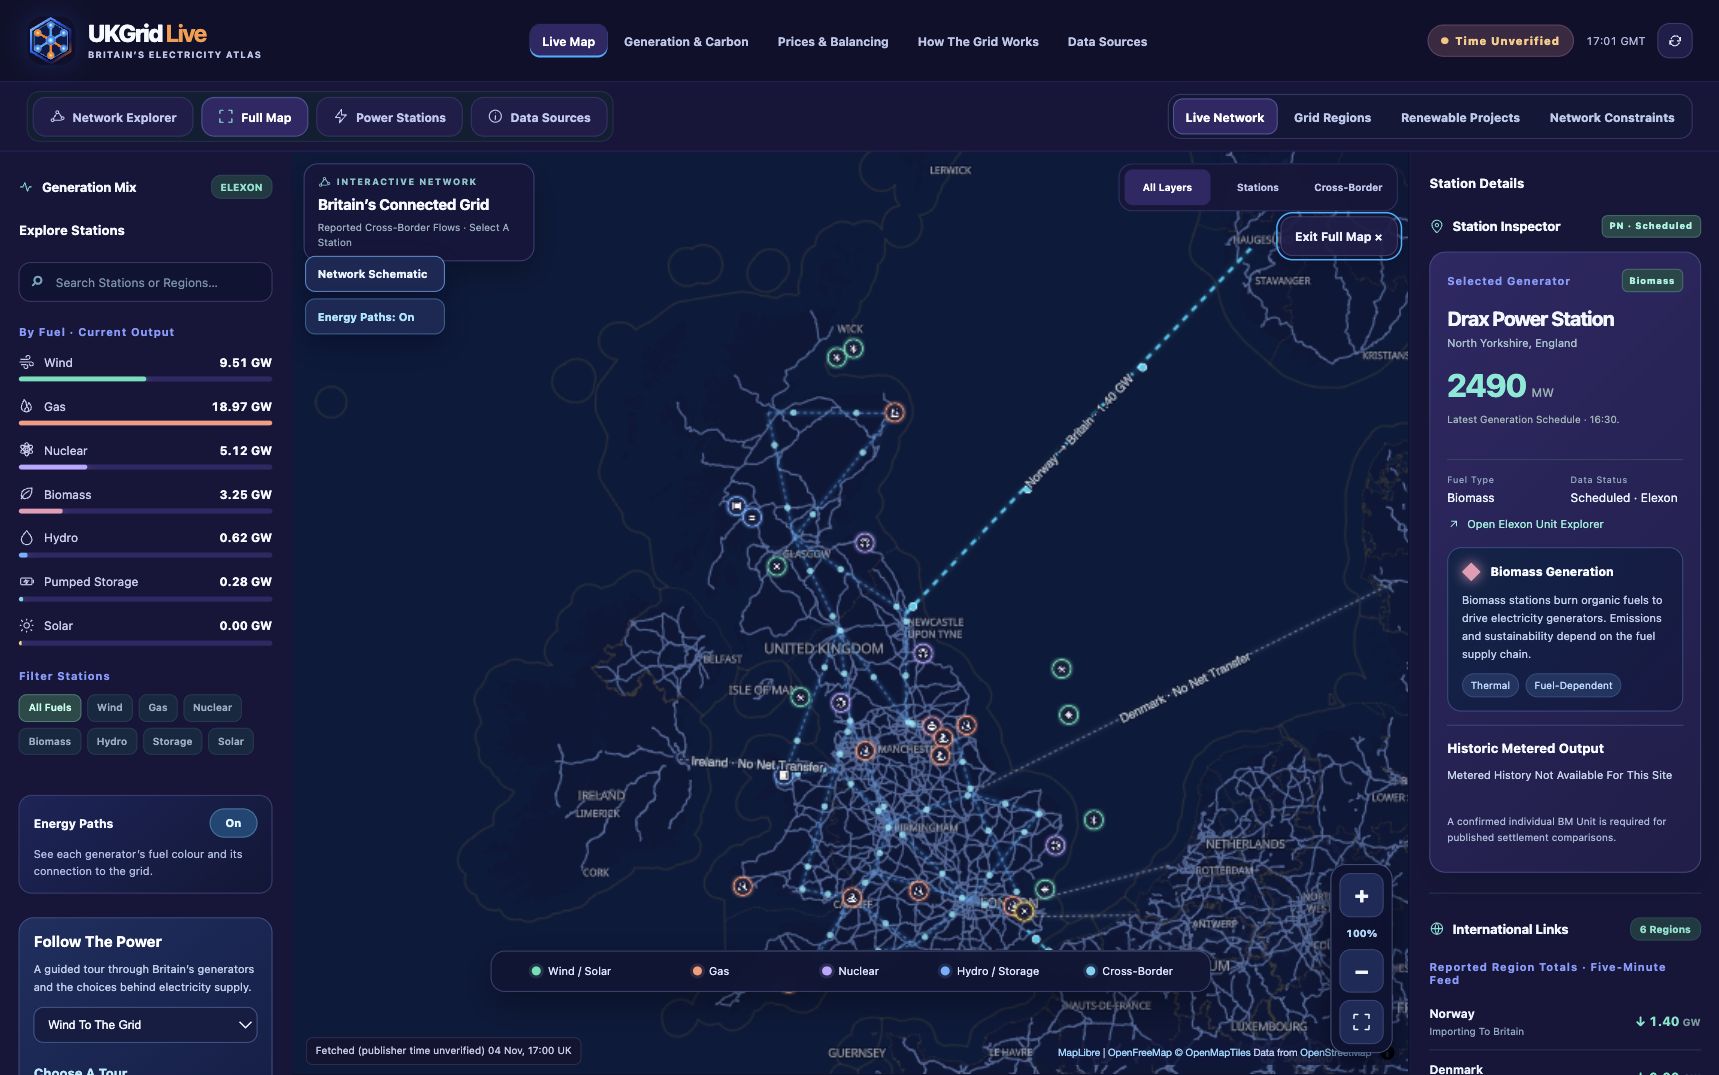
The Story
Electricity is easy to take for granted. Behind the socket is a remarkable network of stations, renewable projects and international connections.
UKGrid Live opens a window onto that world, so you can discover the scale of it and see everyday energy in a whole new way.
Inside UKGrid Live
Explore power stations and connections across Britain, following your curiosity from one place to the next.
See different sources of generation and how the published national picture changes.
Source times and distinctions between schedules and measured values help keep the picture in context.
Explore The Extraordinary
There is a whole story behind the electricity we use. A coastal wind farm, a nuclear station, a gas generator and an interconnector all play different parts. UKGrid Live brings those places together on a map you can explore for yourself.
Follow a source of generation, discover where stations are situated and see how the network stretches across the country. It turns an abstract system into a landscape you can actually recognise.
Understand The Changing Picture
Electricity generation is never a single, static picture. Different sources contribute at different times, and the information available about each part of the system varies.
UKGrid Live aims to keep those distinctions understandable. You can explore published generation and infrastructure information while seeing when figures are unavailable, delayed or based on schedules rather than measured output.